India vs U.S.: Corporate Tax, Incentives & Operating Costs Compared
Why This Comparison Matters in 2026
In 2025, global businesses are no longer asking whether to expand internationally—but where to do it most efficiently. India and the United States now represent two very different, yet equally compelling, business destinations. India offers cost efficiency, manufacturing incentives, and a rapidly expanding consumer base, while the U.S. provides market depth, innovation leadership, and global credibility. According to UNCTAD, India ranked among the top three global destinations for greenfield investment in 2024, while the U.S. remained the world’s largest recipient of foreign direct investment by value. Understanding India vs US corporate tax, incentives, and operating costs has therefore become a strategic necessity—not a theoretical exercise.
Corporate Tax Landscape: Predictability vs Flexibility
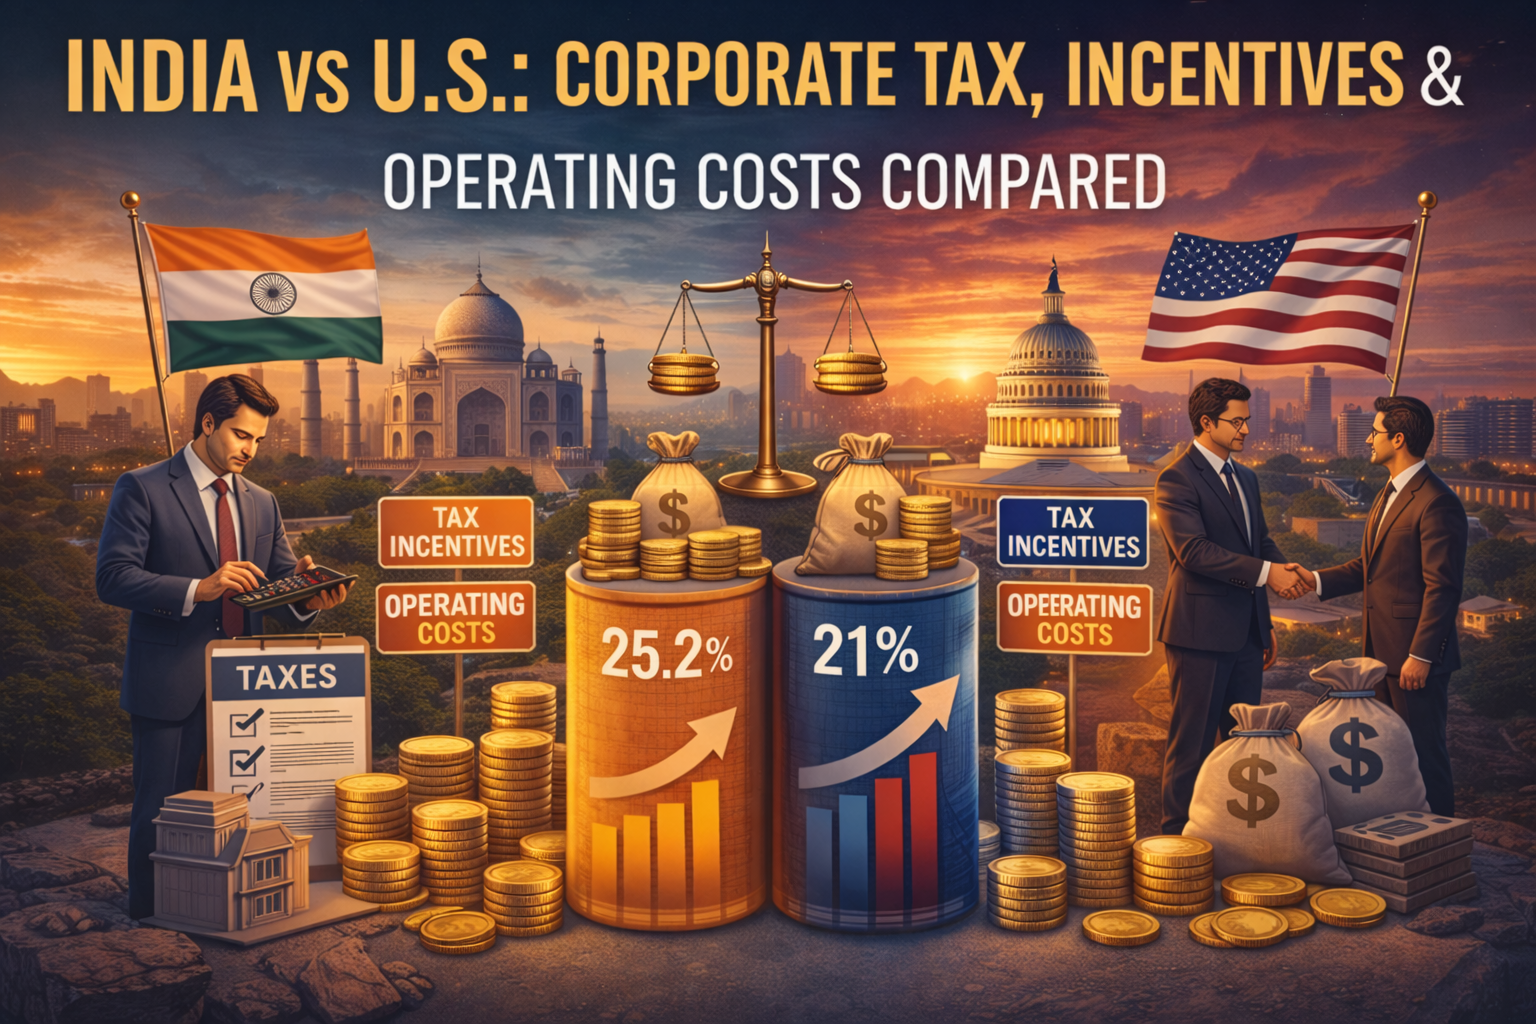
Corporate tax is often the first metric founders compare—and rightly so. In India, the government has significantly simplified its corporate tax regime over the last few years. As of FY 2025, domestic companies can opt for a 22% flat corporate tax rate (effective ~25.17% including surcharge and cess), provided they forgo certain exemptions. New manufacturing companies incorporated after October 2019 can benefit from a 15% concessional tax rate, a move aimed squarely at attracting global manufacturers.
The United States, by contrast, operates under a 21% federal corporate tax rate, introduced under the Tax Cuts and Jobs Act and still in effect in 2025. However, businesses must also factor in state corporate taxes, which range from 0% in states like Texas and Wyoming to over 9% in states such as California. This creates a combined effective rate that often exceeds 25%.
While the federal corporate tax rate is 21%, companies may also face federal surcharges and additional state corporate taxes, which can raise the effective rate to over 25% depending on location and nexus rules.
Key Challenge: Managing Long-Term Tax Predictability Across Jurisdictions
For entrepreneurs planning cross-border expansion, one of the most persistent challenges isforecasting tax exposure over a five- to ten-year horizon. Changes in tax policy, surcharges, deductions, and regional variations can materially affect profitability.In the U.S., this challenge is amplified by the dual federal–state tax structure, where a company’s effective tax rate can shift significantly depending on its state of incorporation and operational footprint. In India, while reforms have simplified corporate taxation, founders often remain cautious about future policy stability and eligibility conditions tied to concessional rates.
Strategic Insight: How Jurisdictional Design Influences Tax Certainty
India’s corporate tax framework offers a relatively uniform, centralised structure, makinglong-term tax planning more predictable for qualifying companies—particularly manufacturers and service providers operating under the concessional regimes. The U.S., by contrast, rewards strategic structuring rather than uniformity. Businesses that carefully select their state of incorporation, manage nexus rules, and leverage federal credits can achieve meaningful tax efficiency, but this requires proactive planning and ongoing compliance oversight. The key distinction lies not in which system is “lower,” but in how much structural flexibility a business is prepared to manage over time.
Incentives That Shape Location Decisions: A Real-World Case Study
Tax rates alone do not determine where global capital ultimately flows. Increasingly,performance-linked incentives play a decisive role in location strategy.In India, the government’s Production Linked Incentive (PLI) schemesspan 14 sectors, including electronics manufacturing, pharmaceuticals, telecom, food processing, and renewable-energy-linked components. Collectively, these schemes carry a total approved outlay of approximately ₹1.97 lakh crore (around USD 26 billion) over their implementation period, reflecting a long-term policy commitment rather than one-time subsidies.
In addition to PLI schemes, India also offers SEZ benefits and export-linked incentives, providing tax exemptions, simplified compliance, and customs advantages for qualifying companies—further enhancing India’s attractiveness as a manufacturing and export hub.
A defining feature of the PLI framework is that incentives are disbursed only after companies achieve predefined production and sales milestones. As confirmed by government disclosures, over ₹21,500 crore in incentives has been disbursed as of mid-2025, linking benefits directly to measurable output rather than upfront capital investment. This output-based approach has materially reshaped how multinational companies evaluate India as a manufacturing and export base.
Real Case Study: Apple’s Manufacturing Expansion in India
Apple Inc.’s expansion of iPhone manufacturing in India illustrates the practical impact of India’s incentive-led strategy. Between 2022 and 2024, Apple’s contract manufacturers—most notably Foxconn and Tata Electronics—significantly scaled operations in India. Public disclosures and government statements indicate that PLI eligibility, combined with competitive operating costs and a predictable corporate tax regime, played a key role in this shift. By 2024, India accounted for approximately 14% of global iPhone production, compared with less than 2% in 2020, marking one of the fastest manufacturing scale-ups in Apple’s global supply chain.
In contrast, the United States follows a decentralised incentive model. Federal R&D tax credits remain a major attraction for technology and innovation-driven firms, while individual states compete through payroll tax rebates, property tax abatements, and workforce training grants. While these incentives can be substantial, they typically requirestate-by-state negotiations, local operational commitments, and ongoing compliance with programme-specific conditions, increasing complexity for foreign entrants.
Key Challenge for Investors: Navigating Incentive Transparency and Access
For many businesses, the primary challenge lies not in the absence of incentives, but inunderstanding eligibility, timelines, and certainty of benefit realisation. Fragmented incentive frameworks can create planning risk, particularly for companies entering a market for the first time.
Strategic Takeaway: Centralised Policy vs Negotiated Incentives
India’s incentive framework offers a centralised, rules-based structure, providing greater visibility on eligibility and outcomes once performance thresholds are met. The U.S. model, while potentially more lucrative for certain sectors, rewards jurisdiction-specific structuring and negotiation expertise. The strategic choice depends on whether a business prioritises policy certainty and scale-linked incentives, or flexibility and customised state-level benefits.
Operating Costs: Where the Numbers Truly Diverge
While corporate tax structures influence long-term profitability, operating costs often create the most immediate and visible differences when comparing India and the United States as business locations. Average professional salaries in India remain approximately 60–70% lower than comparable U.S. roles, even after adjusting for productivity and skill levels. This cost advantage continues to be a key driver for companies establishing delivery centres, technology hubs, and shared services operations in India.
Real estate costs further widen this gap. Commercial office rentals in Indian Tier-1 cities such as Bengaluru, Hyderabad, and Gurugram are substantially lower than those in major U.S. urban centres like New York or San Francisco, where office occupancy costs remain among the highest globally.
Compliance expenses also differ materially. In India, annual corporate compliance—including statutory audits, filings, and GST returns—remains relatively affordable for small and mid-sized enterprises. The U.S., while digitally efficient and procedurally transparent, imposes higher ongoing costs related to accounting, insurance, payroll administration, and employment compliance, particularly for foreign-owned businesses operating across multiple states.
That said, higher U.S. operating costs often come with strategic advantages, including easier access to venture capital, stronger consumer purchasing power, and faster pathways to global market credibility.
Illustrative example:
A SaaS company employing 25 professionals could operate a Bengaluru-based team at roughly one-third the annual cost of a similar operation in Austin, Texas—while continuing to serve U.S. customers remotely.
Market Access & Revenue Proximity: Understanding Strategic Advantages
India: Offers a large domestic market with a growing middle class and cost-conscious consumer base, making it ideal for volume-driven manufacturing, tech delivery centers, and scalable service operations.
United States: Provides high purchasing power, global trade hubs, and enterprise customers, ideal for startups seeking venture capital, enterprise contracts, and international visibility.
Side-by-Side Comparison Table
| Factor | India | United States |
|---|---|---|
| Corporate Tax | 22% standard / 15% concessional for new manufacturers | 21% federal + state taxes, varies by state |
| Incentives | Centralised, rules-based (PLI, tax holidays) | Decentralised, state-level & negotiated, R&D credits |
| Operating Costs | 60–70% lower salaries, cheaper office, lower compliance | Higher salaries, office, insurance, and compliance costs |
| Market Access | Large domestic market, growing consumption | High purchasing power, global enterprise market |
| Ease of Incorporation | Streamlined digital processes, MCA portal | State-dependent, Delaware popular for foreign founders |
| Startups Suitability | Cost-efficient scaling | Capital-intensive growth, market access |
Decision Framework: Aligning Jurisdiction with Your Business Goals
Before committing, founders should evaluate four key dimensions:
- Tax Efficiency – Compare flat/concessional regimes (India) vs federal + state layers (U.S.) and predictability.
- Incentive Access – Centralised, performance-based schemes in India vs negotiated state/federal incentives in the U.S.
- Operating Costs – Salaries, rent, compliance, and insurance differences materially affect bottom-line decisions.
- Market Objectives – Prioritise cost-efficient delivery, manufacturing, or high-value market access depending on strategy.
This framework integrates tax, incentives, costs, and market access into a single decision-making tool, helping entrepreneurs choose the most strategically aligned jurisdiction for their growth objectives.
Key Business Risks Addressed
Throughout this comparison, the discussion focuses on three recurring risks faced by entrepreneurs evaluating India and the United States as business destinations:
- Long-term tax predictability
Addressed through a comparative review of corporate tax regimes, highlighting differences in structural stability, jurisdictional complexity, and planning certainty. - Underestimated operating expenses
Clarified by examining recurring costs such as talent, real estate, statutory compliance, and insurance—areas that often materially affect profitability beyond headline tax rates. - Complexity in accessing incentives
Explained through policy-based analysis and real-world examples, distinguishing between India’s centralised incentive frameworks and the U.S. model of negotiated, state-level benefits.
FAQs: Practical Answers for Founders
- Which country has a lower corporate tax burden?
India generally offers a lower and more predictable effective corporate tax burden for qualifying companies, particularly manufacturers and entities opting for concessional regimes. In the U.S., while the federal corporate tax rate is competitive, state-level taxes and compliance costs can increase the overall effective burden. - Do foreign founders need local partners to start a company?
No. Both India and the United States permit 100% foreign ownership in most sectors, subject to regulatory compliance. Certain regulated industries may impose additional conditions or approval requirements. - Which country is better suited for startups?
The answer depends on the business model. India is well-suited for cost-efficient scaling and talent-driven operations, while the U.S. remains attractive for capital-intensive startups seeking proximity to investors, enterprise customers, and global markets.
Regulatory Developments to Watch: 2025 Snapshot
India has continued to extend and operationalise key Production Linked Incentive (PLI) schemes into FY 2025–26, with ongoing focus on electronics manufacturing, semiconductor supply chains, and renewable-energy-linked components. These extensions reinforce the government’s long-term commitment to output-based incentives rather than upfront subsidies, providing greater visibility for manufacturers planning multi-year investments.
In the United States, IRS clarifications issued during 2023–2024 on the capitalisation of R&D expenses under Section 174 are having tangible effects on startup cash-flow planning in 2025. Early-stage and innovation-driven companies are increasingly required to factor deferred tax deductions into their financial models, influencing both funding strategies and jurisdictional planning.
Conclusion and Forward Outlook
There is no single “winner” in the India vs US corporate tax discussion—only alignment between jurisdiction choice and business strategy. Companies that evaluate corporate taxation alongside incentives, operating costs, and long-term scalability are better positioned to make resilient, future-proof decisions rather than short-term cost-driven choices.